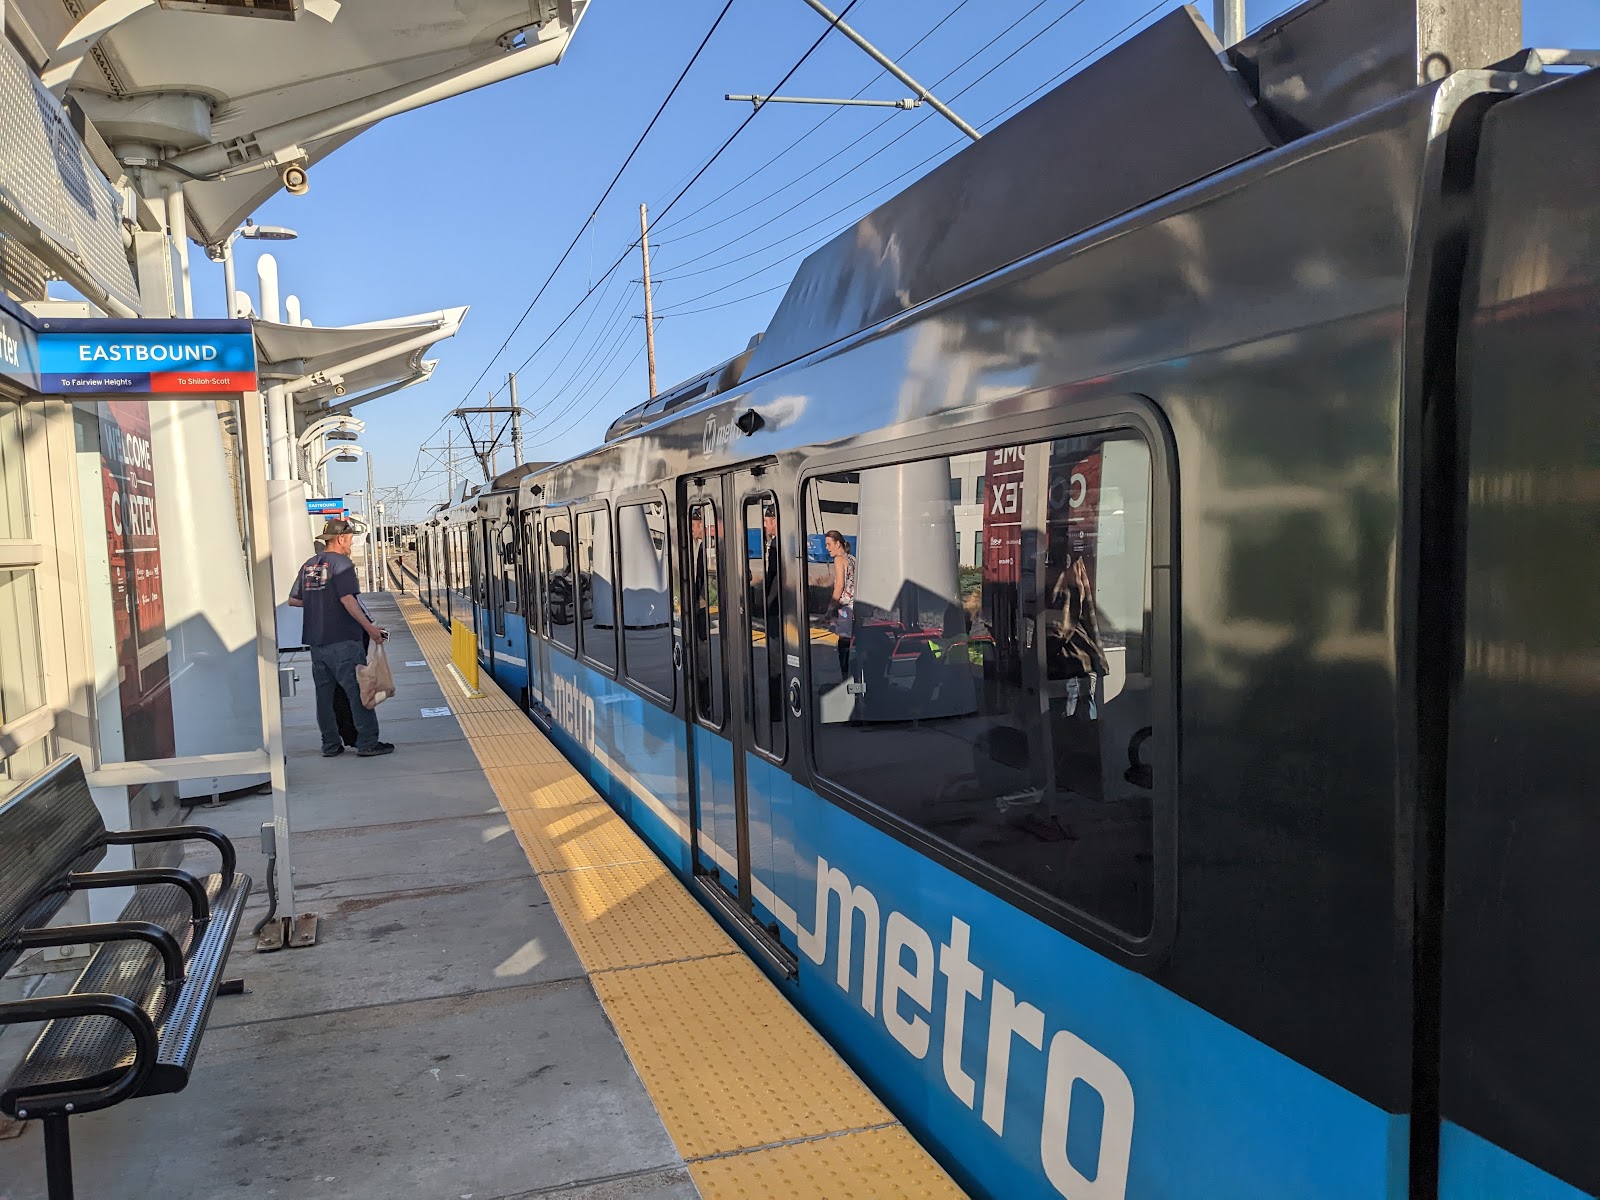
Transit is in trouble. During the COVID-19 pandemic, ridership plummeted. And in the vast majority of cities across the country, ridership has not come close to returning to pre-pandemic numbers.
Part of the problem is that during the pandemic many front-line transit employees either became sick and couldn’t work, or were so worried about getting sick that they quit their jobs. Transit agencies were forced to cut back on routes and service hours simply because of labor shortages. Service levels have largely been restored but in most cases ridership isn’t rebounding at the same pace.
During the pandemic, the Federal government approved about $69 Billion in various COVID-19 relief packages in order to keep transit systems running. That money was crucial in filling financial gaps in transit budgets across the country, but that money is starting to run out. Cities are going to have to figure out how to finance transit with the reduced fare revenue resulting from ridership declines. [1]
The real problem, however, is that transit wasn’t doing that well before the pandemic. In most cities, transit ridership accounts for just a small fraction of the total trips taken. In Chicago, for example, the percentage of daily trips taken in the Fall of 2019 (pre-pandemic) was just 4.4 percent. Two years later (Fall of 2021), the percentage was just 1.7 percent. In less transit friendly cities the situation is even worse, with the percentage of trips taken via mass transit typically tracking at less than 1 percent. [2] Despite all the money spent on transit infrastructure and all the clever marketing campaigns, transit systems are in danger of becoming irrelevant to most urban residents.
That need not be the case. Yes, mass transit systems are often viewed as chronically under-performing their potential, but perhaps we have been measuring their value in the wrong way. And even more importantly, perhaps we have focused transit systems on the wrong kind of trips and priced those trips in a way that limits their usefulness and popularity. This is the first of a two-part series looking at transit data with a slightly different perspective and thinking about the future of transit in a slightly different way.
Big Data
To understand where things currently stand, I’m going to rely upon two sources of “big data” that contain some revealing information that goes well beyond gross ridership and cost statistics. The first is the National Transit Database maintained by the Federal Transit Administration. This database is a treasure trove of information self-reported every month by virtually every transit system in the country.
The second source comes from Replica (www.ReplicaHQ.com), a company that builds large-scale models of mobility activity to better understand how, why, when and where people move around. Starting with a massive amount of data from a variety of sources, Replica builds a “synthetic population” that mimics the activities and movements of residents, visitors and commercial vehicle fleets for a typical weekday and weekend day in a given season. The result is a richly descriptive data set containing the characteristics of both the trip itself and the person taking each trip.
Understanding Where We Are
Quantifying the impact of the pandemic is a good place to start. To get a representative overview, I selected data compiled from the National Transit Database for five cities in the Midwest (St. Louis, Chicago, Grand Rapids, Cleveland, and Des Moines) that all have active transit programs but which have different geographic and demographic profiles. The chart below shows the change in ridership levels from January 2020 through September of 2022 (with January 2020 = 100). By May of 2020, transit ridership had plummeted to an average of just one third the pre-pandemic levels. Ridership slowly rebounded over the next 2 years, although there is noticeable volatility as various COVID strains came and went. All of the transit systems were trending up in September of 2022 but the average ridership was still less than 70 percent of pre-pandemic levels. [3]

One possible explanation for the low ridership numbers is that transit systems had a difficult time staying fully staffed and often had to cut routes or curtail frequency of service. The second chart shows the change is transit service hours, again with January of 2020 as 100. The level of service clearly dropped for all of the systems evaluated, but not nearly to the degree that ridership dropped. In many cases the drop in service hours was less than half the drop in ridership, so clearly there are other factors involved. [4]

Another possible explanation is that people were anxious about being in an enclosed transit vehicle with lots of strangers during the pandemic. That seems particularly plausible early on but less convincing in recent months. Airline travel, for example, has rebounded strongly even though the anxiety level should be similar. A more likely explanation, in my opinion, is that the work-from-home trend has eliminated many of the commuting trips by white-collar workers on their way to the office. As the number of white collar commuters has dropped, there may also be concerns about the rising potential for personal violence as the perceived “safety in numbers” fades along with the decline in middle class commuters.
While the pandemic was clearly disastrous for transit systems, the longer term trends are just as troubling. Using the same sample of five Midwestern cities but expanding to 12 years of data from the National Transit Database, the clear trend in ridership is a slow downward slope. As the next chart shows, the average ridership level in 2019 is nearly 20 percent below what it was in 2012. [5] Even if transit systems recover from the pandemic trough, is there any reason to believe that the longer term decline will be reversed? Unless there are significant changes, probably not.

What is worse, is that this decline in ridership is taking place despite significant financial subsidies. A study released prior to the pandemic by the Federal Transit Administration showed that the Farebox Recovery Ratio over a 10-year period of time was consistently between 33 and 35 percent. [6] That ratio has probably gotten worse since the pandemic. In general, the higher the ridership levels the smaller the gap between fare revenue and trip cost, but all transit systems are heavily subsidized or financed in ways that go beyond fare revenue.
Before changes are planned, however, some thought should be given to why long-term transit trends are negative. In my opinion, it has to do with fundamental changes in where people live, where people work, and how we move from place to place – changes that have been in the works for the past fifty years. In the 1950s and 60s, jobs were clustered in the central business district of most metro areas. These traditional downtowns were the predominant centers for office and retail development, and warehousing and light industrial development was often nearby.
That has changed in recent decades. The central business district has declined in importance and is now just one of several employment centers in most metro areas. Retail shops moved to suburban malls, and many office users moved to outlying office parks with plenty of free parking. Warehouses and factories moved to peripheral locations near the interstate highway system where they could build huge, single-story buildings and have easy access for truck traffic which was rapidly replacing rail access as a key transportation mode.
The dispersion of jobs made the original focus of transit systems obsolete. No longer was it crucial to ferry workers into a central business district. Now workers needed to travel to many different parts of the metro area which didn’t mesh well with a hub-and-spoke transit system focused on downtown. Consequently, transit routes (at least the bus portion) shifted to more of a modified grid structure that could take people almost anywhere, but much less efficiently. Trips to outlying locations often took more than one bus/train and might be an hour or more in duration. And the increasing geographic coverage meant that the frequency of service had to be reduced to stay within transit budgets. No wonder commuters started looking for other options.
At the same time, middle- and upper-class families started migrating to suburban locations where they could purchase a larger house with a larger yard. The trade-off was a growing reliance on the automobile as the primary mode of transportation. Rising affluence made two- and three-car families common where once that had been reserved for just the wealthy. The result was a steady decline in transit ridership and an increase in car traffic. It is trendy to decry this change as being universally bad for the character and vibrancy of cities – and there certainly are problems – but it also ushered in an era of unmatched personal mobility that offered clear advantages for many families.
Ridership Isn’t the Whole Story
Although ridership is the most common performance measure for transit systems, it doesn’t tell the full story regarding the usefulness of transit nor does it give any clues for how transit performance might be improved. For that, we need to understand the differences between the typical transit rider and the general population, and between the typical transit trip and the trips taken with other modes of transportation. To get that level of understanding, I’m going to focus on Cleveland, Ohio although I will make occasional comparisons with other cities. Cleveland has a variety of transit options and is roughly representative of other midwestern communities. I’m also going to turn to the magic of Replica data so that I can focus on the personal characteristics of transit riders versus all travelers (regardless of the mode of transportation).
As might be expected, transit travelers tend to be somewhat poorer and more racially diverse than the full population of travelers. As the table below shows, the percentage of transit riders that had a household income of less than $50,000 in Cleveland was 42% higher than the percentage of all travelers that fell into the same income category (Fall 2019). Interestingly, the impact of the pandemic, aside from reducing ridership, was to make the transit ridership more middle class. The income distribution of transit riders in the Fall of 2021 was similar to that for all travelers.
Percentage of Travelers by Household Income
Cleveland Metro Area
Source: ReplicaHQ.com
In Chicago, transit riders also tended to be poorer than travelers in general, but the impact of the pandemic was to increase low-income transit ridership even more rather than to shift toward the middle class.
Another important distinction between transit travelers and the general traveling public is the access to alternatives – particularly access to an automobile. Again as expected, transit riders are much less likely to have a car as a transportation option. This is particularly true for auto-oriented metro areas such as Cleveland and St Louis.
Percentage of Travelers without Access to an Automobile
Source: ReplicaHQ.com
The final slice of Replica data that I think is relevant is the employment status of travelers, both in general and on transit systems. The following table uses data for Cleveland, and again the impact of the pandemic is noticeable.
Percentage of Travelers by Employment Status
Cleveland Metro Area
Source: ReplicaHQ.com
Even before the pandemic, transit was clearly important to workers. Nearly the same percentage of transit travelers were employed as the general traveling public. Given the differences in income distribution, however, it is probably safe to assume that transit is particularly important to workers in the low- and moderate-income categories, and especially those without a car.
After the pandemic hit and was winding down (Fall 2021), workers were still using transit even though other groups had cut back. The reduction was especially true for those classified as Not In the Labor Force (e.g. retired, disabled, college students, etc.), a group which includes many poor households and many households without access to a car. This group still made roughly as many trips as before, just not using transit.
In short, transit systems are doing pretty much what we expect them to do – transporting a wide variety of people but with a focus on the lower end of the economic spectrum. Ridership dropped during the pandemic but the people who kept riding were largely workers. In all likelihood, they were workers at the types of modest paying jobs that are essential to keeping hospitals, supply chains and utility systems operating. During the height of the pandemic Jarret Walker wrote:
In transit conversations we often talk about meeting the needs of people who depend on transit. This makes transit sound like something we’re doing for them. But in fact, those people are providing services that we all depend on, so by serving those lower income riders, we’re all serving ourselves. [7]
How much economic chaos would we create if transit were eliminated and every janitor, retail clerk, warehouse worker, and administrative assistant had to be paid enough that they could afford to drive to work? As has already been documented, transit systems are heavily subsidized but perhaps that is not a subsidy solely for the benefit of transit riders, but for the benefit of businesses that employ low-wage workers and our own preference for low-density sprawl that makes efficient transit service impossible. Despite its inefficiency, transit service might be the essential element that makes the rest of our urban choices work.
Surely if transit service wasn’t important, there would be lots of cities across the country that didn’t offer it at all. A recent study, however, only found five cities with a population over 100,000 that did not have a traditional transit system of some type. [8] The largest is Arlington, Texas which is at the crossroads of seven interstate highways. Arlington, of course, is part of the Dallas metro area which means there are transit systems nearby, just not in the city itself. In second place is Cape Coral, Florida, a city carved out of swampland with more miles of canals than Venice, Italy. The dearth of transit-free cities and the relative support for transit shown by voters indicates that transit provides a public service that city residents value even if most of them don’t take advantage of that service themselves.
Conclusions
Here is the paradox posed by transit service:
Our country is increasingly urbanized (now over 82 percent of the US population) and urbanized areas are the driver of economic growth and cultural creativity;
Transit service is arguably an essential element of urban prosperity; and yet
Transit ridership is slowly declining despite massive subsidies.
As noted earlier, transit is in trouble. In my opinion, the solution is not more of what we already have nor is the answer across-the-board service reductions. Instead, I think we need to re-imagine the interface between transit and urban life. Part two of this series will look deeper into the data and propose a new focus for both transit service and transit funding.
Notes:
Jimmy Vielkind; “Public Transit Goes Off the Rails;” Wall Street Journal; January 9, 2023.
Replica “Places” data models for trips where the mode is any form of transit versus all trips excluding pass through trips; Cleveland Fall 2019 = 0.8%, Fall 2021= 0.44%; St Louis Fall 2019 = 0.86%, Fall 2021 = 0.42%; ReplicaHQ.com.
Federal Transit Administration, National Transit Database, summarized by Chris Arvin and Kat Siegal; Monthly unlinked passenger trips on services directly operated by the primary transit provider in each metro area, expressed as a percentage of prepandemic levels; https://transitrecovery.com/
Federal Transit Administration, National Transit Database, summarized by Chris Arvin and Kat Siegal; Monthly service hours delivered on services directly operated by the primary transit provider in each metro area, expressed as a percentage of prepandemic levels; https://transitrecovery.com/
Federal Transit Administration, National Transit Database; September 2022 Adjusted File; Annual unlinked passenger trips on services directly operated by the primary transit provider in each metro area, expressed as a percentage of ridership in 2012.
“National Transit Summary and Trends: Appendix;” Federal Transit Administration, Office of Budget and Policy; November 2015; https://www.transit.dot.gov/sites/fta.dot.gov/files/2020-06/2014%20NTST%20Appendix.pdf
Jarrett Walker; “In a Pandemic, We Are All Transit Dependent;” Bloomberg City Lab; April, 2020; https://www.bloomberg.com/news/articles/2020-04-07/in-a-pandemic-we-re-all-transit-dependent
John Harrington; “America’s Largest Cities With No Public Transportation;” 24/7 Wall Street; Novembers 2018; https://247wallst.com/special-report/2018/11/27/americas-largest-cities-with-no-public-transportation/2/
No comments:
Post a Comment