I have lived in the same house for more than 35 years. It meets all of my needs and it is located in a good neighborhood with convenient access to the places that we go on a regular basis. More importantly, the unpaid balance on my mortgage is less than a third of the value of the house and my interest rate is just over three percent. Am I anxious to move? Not in this housing market.
On almost a daily basis, the mainstream press puts out a new variation on the “housing crisis” story. The current market is described in cataclysmic terms and statistics are quoted that show housing costs are at unbearable levels. There are, in fact, problems with both housing affordability and availability but most articles seem more focused on “the sky is falling” story lines rather than a clear analysis of the problems or any logical strategies for solving the problems. My goal with this post, and the subsequent ones that follow, is to sift through the mountain of housing data to find the nuggets of information that are actually useful in understanding the dynamics of the current housing market, and then to lay out some suggestions for making things better.
To begin with, many articles focus on just the total cost of housing because total cost is an easily understood statistic. And yes, the total cost of housing has risen dramatically in recent years. From the first quarter of 2020 through the fourth quarter of 2022, the median sales price of new homes sold in the U.S. rose 46 percent from $329,000 to $479,500. [1] The problem with this type of statistic is that the average hides a great deal of variability, total price hides the fact that there are multiple factors at work, and using the cost of new homes ignores the reality that most people buy an existing home rather than a newly built one.

For example, the use of a national average obscures the great degree of variability between states (and even within states). If you look at the typical home values by state according to Zillow, homes in California are more than triple the cost of homes in Ohio, Iowa or Kansas. In fact, virtually the entire midwest has average home values well under $300,000 compared with $760,000 in California, $607,000 in Massachusetts, or $586,000 in Washington. [2]
Exactly how bad is it?
Regardless of location, however, the point remains that housing costs have risen more rapidly than income to the point where finding appropriate housing at an affordable price is challenging for many households. To really understand how bad it is, I’m going to look at the issue from a variety of perspectives.
Let’s start with a hypothetical family in Columbus, Ohio, that earns the median income for the area ($75,800) and would like to buy a house. If we start with the common practice that a mortgage payment should generally not exceed 35 percent of monthly gross income, that means that the household has $2,110 per month to work with. [3] Let’s assume that $610 per month would go toward escrow for property taxes and insurance, that leaves $1,500 for principal and interest. At current interest rates of 6.75 percent, that means that the maximum loan amount would be roughly $231,000. Unfortunately, the median priced home for sale in Columbus is approximately $328,000 leaving a gap of almost $100,000. This means that our hypothetical household has to either (1) make a huge down payment, (2) pay a higher portion of income for housing and economize elsewhere, or (3) start looking for houses much nearer the bottom end of the market. Families making substantially less than the median income are likely limited to just rental options.
Columbus is one of the more affordable metro areas in the country with a ratio of median housing cost to median income of 4.3 (Kansas City and Chicago are at 4.4, Minneapolis is at 4.2 and Indianapolis is at 4.1). This is well below the national average of 5.8 and much better than several California cities where the ratio is 9 or above. The national average, however, is 50 percent higher than it was in 2000. The net effect of housing cost rising faster than income is that more and more households are priced out of the home ownership market. [4]
A second way to look at this issue is to compare the change in home values with the change in income over time. According to data from the Federal Reserve, the median value of single family homes has increased more than twice as much as household income since 2000. If home prices had grown at the same rate as income during that time period, the median home value would be roughly $294,000 – about 32 percent less than the 2022 value of $433,000.

A broader measure of housing affordability is the percentage of households that are considered “cost burdened” with respect to their housing expenditures. According to the Joint Center for Housing Studies at Harvard University, a household is considered cost burdened if it spends more than 30 percent of its gross income on housing (either rental or owner occupied) and is severely cost burdened if it spends more than 50 percent. [5]
The impact of being cost burdened with respect to housing differs with household income. An affluent family might be cost burdened if they opt for a lavish residence, but their ability to meet other budgetary needs is unlikely to be severely compromised. A poor household, however, is likely to be cost burdened because no other acceptable options exist, and the ramifications of spending 40 or 50 percent of income on housing is that cutbacks have to be made on food, transportation or medical costs. High housing costs can easily keep households living paycheck to paycheck – thus making wealth building impossible. This, in turn, perpetuates poverty and undermines the American dream of being upwardly mobile due to hard work and ingenuity.
The table below shows the percentage of all households that are considered cost burdened in three representative midwestern metropolitan areas.
Percent of All Households that are Cost Burdened
What is more remarkable, however, is when this same measure is applied only to households that rent. Housing costs tend to be flat over time for people who own their home, but housing costs escalate over time for households that rent. Consequently, homeowners may grow out of being cost burdened as their incomes rise, but renters are much less likely to accomplish the same thing.
Percent of Rental Households that are Cost Burdened
The difference is stark and it underscores the point that the housing affordability crisis is more problematic for renters than it is for homeowners. The headlines may focus on the cost of buying a home but the issue is far more severe for those whose only choice is to rent. And the lower the household income, the higher the probability of being cost burdened – to the point where more than 70 percent of poverty-level households are severely cost burdened. Eventually, of course, you reach the level of the more than 600,000 people who are homeless on any given night. All of the cost burdened numbers, by the way, are record highs for as long as the Census Bureau has been tracking this statistic.
Housing Cost Components
The statistics above should make it fairly clear that there is a housing affordability problem. But none of those statistics answers the question of why housing has become so expensive. To figure that out, a much deeper dive into the data is required and it starts with a look at the various factors that determine housing cost. Understanding the impact of each cost component is the first step toward developing a rational strategy for addressing the problem.
Cost of land. To anyone who has driven through the deserts of the southwest, the farm fields of the midwest, or the wilderness forests of the far north, it may seem like this country has so much vacant land that the cost should be nearly zero. That assumption, however, would be wrong because the vast majority of people don’t want to live in the wilderness. They want to live near their jobs, their friends and the attractions of major cities. Land in cities is expensive for reasons of supply and demand. When it comes to land for housing, people generally want the location of their residence to be sheltered from the hubbub of commercial and industrial activities, but reasonably near their place of work, the places they shop, their doctor’s office, their church and a dozen other places. It turns out that not much land meets all those criteria which means supply is low relative to demand.
It also turns out that getting land ready for housing development involves a lot of grading and infrastructure construction which is expensive. Some cities used to help developers out by allowing much of this cost to be covered by a municipal bond which would be paid back through special assessments tacked on to the property taxes for each new lot. That turned out to be bad for the financial health of cities, so now most developers have to front these costs themselves, meaning that it gets included in the cost of each developable lot. The net result is that the cost of land can easily end up being 15 to 25 percent of the final cost of a new single-family home.
Nationwide, the average cost for a finished lot for a new home is roughly $55,000. This is up from approximately $35,000 twenty years ago. [6] If you adjust for inflation, this means that land costs have been relatively flat. However, the nationwide average hides a great deal of variability once again. In major metropolitan areas or popular resort areas the costs can easily be two to five times greater, and in extreme cases eight to ten times greater. If a typical suburban lot in a nice subdivision is $125,000 to $150,000, it isn’t surprising that the resulting house will be $500,000 and up. The bottom line is that the cost of land is a major component in the cost of housing, although it may not be particularly at fault for the recent run-up in housing costs.
Direct construction costs. This is the housing cost category which is probably most obvious and, as it turns out, one of the primary factors responsible for recent housing cost increases. The COVID-19 pandemic disrupted supply chains, shipping costs, labor availability, and manufacturing practices which ended up causing the cost of construction to skyrocket. According to data from the Federal Reserve Bank of St Louis, the Producer Price Index for Building Materials and Supplies (2004 = 100) increased from approximately 155 in April of 2020 to 260 in March of 2022 – an increase of 67 percent in two years. [7]

The index has since moderated to around 210 but that is still a 35 percent increase over three years. It is also not clear how fast the declining prices are showing up in finished construction costs quoted by builders. A volatile market may have made builders prone to overestimate costs so they don’t get burned by another price spike. The bottom line is that construction costs exploded during the pandemic and haven’t fully returned to normal levels. Whether they will in the future is unknown at this point but the index has been flat (rather than declining) for the past year or so.
Building and development fees. Virtually every city in the country issues a building permit for new construction and charges a fee for the plan review and inspection work that goes along with the permit. This permit fee has been around for decades and rarely exceeds one percent of the ultimate price of the eventual structure – and so is not a major contributor to housing inflation. However, there is another class of fee that is less universal but which is growing in popularity. These charges, known generically as exactions or impact fees, can end up costing tens of thousands of dollars per housing unit which is not a trivial amount.
Impact fees first became popular in cities that were growing rapidly. Growth, and especially rapid growth, brings with it the need to widen roads, build new facilities such as schools, parks and sewage treatment plants, and hire new police officers and firefighters. Existing residents got tired of seeing their taxes go up to pay for these expenses that they attributed solely to new growth. They argued that the financial impact of new growth should be borne by the new residents rather than by existing residents. Thus, the creation of “impact fees” which were designed to have each increment of new growth (each residence, each shop, each office building) pay for the anticipated financial impact that it would generate. Initially, impact fees were limited to a few hot-button issues such as traffic improvements or new schools, but they have proved so lucrative that they have been expanded to a wide array of municipal infrastructure and services.
Not every city charges impact fees and the amount charged varies widely from city to city. As cities become more strapped for cash, however, impact fees can become an enticing new source of revenue – one that is typically not limited by state caps on property taxes or sales taxes. The bottom line is that development fees can have an impact on housing costs and in some locations have undoubtedly contributed to the escalation of housing prices.
Profit, overhead and commissions. This cost category is a potential bright spot in the fight against high housing costs, although probably not enough of a bright spot to make a major difference. Profit and overhead for builders seems to have remained relatively flat as a percentage of total housing cost. There can be exceptions, of course, but generally there is enough competition in the construction industry that profit margins rarely get out of control.
The bright spot comes with respect to realtor commissions. A recent court verdict and a slew of pending court cases threaten to disrupt the commission rates that have historically been locked in place by the real estate industry. Technology has broken the stranglehold that realtors had on market information and transaction processing, but commission rates have stayed at high levels (typically around 6 percent of the sale price). If the current court ruling stands, the cost of real estate services could be reduced by up to half. This may take several years to play out, but my guess is that the role of the realtor is likely to follow the path of the stockbroker and travel agent.
Financing costs. Over the past two years, no component of housing cost has had as much of an impact as the interest rate charge for a typical mortgage. As recently as January of 2021, the average 30-year mortgage rate was around 2.65 percent. In early November of 2023 it peaked at 7.75 percent. [8] To put it in dollars and cents, the payment for principal and interest on a $300,000 loan amount would have gone from $1,209 to $2,149, an increase of 78 percent. No wonder housing affordability has taken a hit in recent months.

The good news is that mortgage rates are already showing signs of moderating and have dropped below 7 percent. With inflation appearing to be somewhat under control, many experts believe that mortgage rates will continue to drop. It is important to point out, however, that the sub-3 percent interest rates of a few years ago were a historical anomaly and are not likely to be repeated in the near term. Over the past 30 years, the average rate for a 30-year, fixed rate mortgage is approximately 5.6 percent and that level is probably a reasonable target for the next couple of years.
Taxes and insurance. The final component of housing cost includes two factors that vary widely from place to place. Both costs are typically rolled into the mortgage payment so many people aren’t really aware of how much they pay, but the amount is a significant contributor to total housing cost – often in the neighborhood of 20 percent of the annual total. Property taxes as a percentage of house value tend to be relatively stable, but since housing values have been rising rapidly the actual dollar amount has also been rising. This is often seen as a source of cash flow stress for homeowners on a fixed budget, although it does mean that their total wealth is likely increasing.
Insurance costs have traditionally been relatively stable as well, although recently costs have been rising more rapidly – by double-digit percentages in some cases. States seen as being at high risk for natural disasters such as hurricanes or wildfires have been particularly hard hit in the past few months. In California and Florida several insurance companies have gone bankrupt and several others have decided not to write new policies because insurance rates have not been allowed to rise rapidly enough to cover potential claims. The bottom line is that insurance costs are likely to keep increasing although homeowners that avoid high risk locations and take steps to make their homes less prone to damage should be able to keep increases to reasonable levels.
Supply and Demand
While increases in several housing cost components – particularly land, construction costs and financing – explain a great deal of the housing affordability problem, there is another issue that has generally received less publicity. Like any commodity, the cost of housing is affected by the laws of supply and demand. In the last couple of years in particular, the balance between supply and demand has gotten out of whack for a couple of different reasons and the result has been an under-supply of new housing units which leads to price inflation.
The basis for demand, of course, is the number of households seeking a place to live. In the long run, the growth in households is based on the growth in population but in the short run other factors can come into play. For example, following the Great Recession many young adults did not form households at the expected rate. They moved back in with their parents or shared housing with other young adults. The share of the population aged 25-34 heading a household fell from more than 45 percent in 2006 to roughly 40 percent in 2017.
That trend has sharply reversed over the past five years and the result has been an unexpected surge of new households seeking housing. For example, for the five-year period from 2011 to 2016 the expected number of new households based solely upon population change was 1.35 million households per year. The actual number was 774,000 annually, a deficit of 579,000 households per year. From 2016 to 2021, the expected number of new households was just under 1.1 million households per year but the actual number was over 1.7 million households. That is an annual surplus of 640,000 households, or a swing for the 10-year period of 1.2 million households. [9]
Unfortunately, the supply side of the equation has not kept pace, particularly with respect to single family homes. Since peaking at the end of 2020 at an annual rate of 1.3 million housing starts per year, single family home construction plummeted to a low of 820,000 new starts by the end of 2022. New home starts have bounced back somewhat over the past few months but have still not gotten back to the historical average.
At the same time, the sale of existing homes has fallen as well. Homeowners with mortgages in the 3 to 4 percent range have been reluctant to give those up for a new location with a mortgage at double that rate, even if the inclination to downsize or relocate is strong. Consequently, the supply of homes for sale is near record lows. [10]
Homes For Sale and Months of Supply
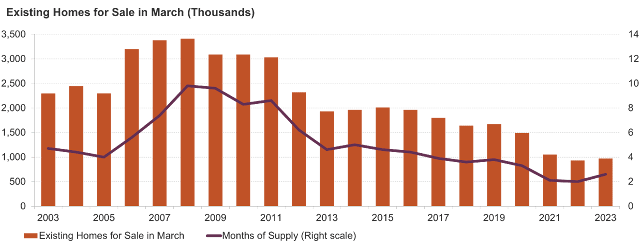 |
| Source: Joint Center for Housing Studies of Harvard University |
Multi-family construction has stayed strong until recently which has helped bridge the gap in terms of available housing units. The problem is that for both single-family homes and multi-family apartment projects, new construction has focused on the high end of the price spectrum. Home builders are finding it more lucrative to focus on large, elaborate homes rather than starter homes, and multi-family developers are finding it far easier to get high end projects approved for construction as opposed to moderately priced apartments that generate NIMBY opposition. Thus, supply is tight, demand is high, and the housing being built isn’t focused on the low- and moderate-income households where housing choices are most limited.
Summary
Our country has a housing affordability and availability problem. This isn’t the first time this has happened and it surely will not be the last, but that doesn’t make it any easier to tolerate for those caught in a housing crunch. The side effects of this housing crisis ripple throughout our economy and society.
In summary, there are two things to keep in mind. First, the housing crisis is not just about young professionals who are not able to buy a house. Yes, that problem exists but the housing crisis extends all the way up and down the economic spectrum and the lower you go the more severe the problem becomes.
Second, there is no single cause for high housing costs. It is not just high interest rates or high building material costs that are to blame. There are many factors contributing to high housing costs which is why the problem is so difficult to solve – there is no single fix. Because the problem is difficult, the housing industry has reverted to what is easiest - building high end single family homes and large apartment complexes for affluent households.
I think there is a decent chance that housing costs will actually moderate over the next 12 months. We may be in a bit of a housing bubble at the moment (but not like 2008 - 2010) and that bubble may be starting to pop. I don’t believe, however, that any bubble popping will really solve the current housing crisis. There are significant structural changes that need to be made to the housing industry to even come close to giving most households a reasonable selection of affordable housing options. What are those changes? Check back next month for the second part of this series!
Notes:
1. Jack Caporal; “Average House Price by State in 2023”; The Ascent; November 2023; https://www.fool.com/the-ascent/research/average-house-price-state/#:~:text=Average%20home%20price%20in%20the,when%20the%20median%20was%20$329%2C000.&text=MEDIAN%20SALES%20PRICE%20OF%20HOMES%20IN%20THE%20U.S.
2. Op. Cit. Caporal.
3. Dori Zinn, Josh Patoka; “What Percentage of My Income Should Go To My Mortgage?”; Forbes Advisor; June 2023; https://www.forbes.com/advisor/mortgages/mortgage-to-income-ratio/#:~:text=The%2028%25%20rule%20says%20that%20you%20shouldn%E2%80%99t%20pay,earn%20%247%2C000%20every%20month%20in%20gross%20household%20income.
4. Jaime Dunaway-Seale; “Home Prices Are Rising 2X Faster Than Income”; Home Bay; November 2023; https://homebay.com/income-to-house-price-ratio-2023/#home-prices-versus-income
5. “Renter Cost Burdens Reach Record Levels”; Joint Center for Housing Studies of Harvard University; 2023; https://www.jchs.harvard.edu/son-2023-cost-burdens-map
6. Natalia Siniavskaia; “Lot Values Set New Records”; National Association of Home Builders; September 2022; https://eyeonhousing.org/2022/09/lot-values-set-new-records/
7. “Producer Price Index by Industry: Building Material and Supplies Dealers”; Federal Reserve Economic Data; St Louis Federal Reserve Bank; December 2023; https://fred.stlouisfed.org/series/PCU44414441
8. “30-Year Fixed Rate Mortgage Average in the United States”; Federal Reserve Economic Data; St Louis Federal Reserve Bank; December 2023; https://fred.stlouisfed.org/series/MORTGAGE30US
9. Daniel McCue; “The Surge In Household Growth and What It Suggests About the Future of Housing Demand”; Joint Center for Housing Studies of Harvard University; January 2023; https://www.jchs.harvard.edu/blog/surge-household-growth-and-what-it-suggests-about-future-housing-demand
10. “The State of the Nation’s Housing 2023”; Joint Center for Housing Studies of Harvard University; https://www.jchs.harvard.edu/state-nations-housing-2023
Special thanks to Rose Saracini for her insights into the mortgage industry and current lending practices.