A little over a month ago, the Census Bureau released the first batch of data from the 2020 Census. Thirty or forty years ago this would have been front page news, but this year it hardly caused a ripple. My guess is that the lack of excitement is a result of two factors: (1) the Bureau’s own annual estimates have become so accurate and comprehensive that the numbers from the decennial census are not much of a surprise anymore, and (2) it is pretty hard for population counts to complete with a global pandemic, climate change, and trillion dollar budget packages.
Anyway, to a city planner like me the Census numbers are still interesting and the trends they reveal are important. This initial release has a very limited scope -- designed mainly to facilitate reapportionment and redistricting -- so any real analysis will need to wait until the more detailed data releases that will be coming out over the next year or so. But I think it is possible to draw some early conclusions on issues relating to broad population trends.
Before jumping into the data, however, there is an important caveat to this census that needs to be understood. The actual census date was in April of 2020, roughly one month into the COVID-19 pandemic. That means that very few of the relocations which took place in response to the pandemic -- particularly the shift to remote work -- will be reflected in the data. It remains to be seen whether the changes that took place will be long term or whether things will revert to prior patterns after a couple of years, but there definitely were changes and the scope and duration of those changes are not yet fully understood.
In keeping with the theme of this blog, I’m going to focus on the midwestern states and major cities although I will start with some national trends to provide context. I’ll use the Census Bureau definition of the midwest region which includes 12 states ranging from Ohio and Michigan in the northeast to Nebraska, Kansas and Missouri in the southwest.
National Trends
The national population numbers don’t really reveal many surprises. The trends are generally continuations of trends that have been in place for at least several decades. The U.S. population grew over the past decade by 7.3%, but that reflects a continuing slowdown in the rate of growth (roughly 13% for 1990 to 2000, and just over 10% for 2000 to 2010). The long running decline in birth rates is the primary cause, along with a decline in immigration particularly during the Trump years.
Birth rates have been slowly dropping for decades (from a high of over 3.5 births per woman during the 1950s to under 2 births per woman now) and I don’t anticipate that will trend upward anytime soon, although it seems to be stabilizing. Many people are choosing not to have children at all and those that do are often waiting until they are older to begin having children which leaves less time for large families to form. Over the past 50 years, a women’s average age at first birth has increased from roughly 21.4 years to 26.8 years. [1] The inevitable result, confirmed by the 2020 Census, is that the U.S. population is getting older. In fact, there were fewer people less than 18 years of age in 2020 than there were in 2010 (73 million vs. 74 million), something that hasn’t happened since 1980. Still, natural population increase (births minus deaths) is a major source of growth for the U.S. and that will continue for many years (although it will slowly dwindle over time). This stands in contrast to many other developed countries where natural population change is already nearly zero or slightly declining.
 |
| Birth Rates Over Time |
Thanks to immigration, the U.S. population is also becoming more diverse. The Census Bureau revised the way in which it asked about racial and ethnic backgrounds to give people greater flexibility to specify how they viewed themselves. One result of this change is that the number of people who identify as “white only” dropped considerably and the number of people who identify as multiracial increased considerably. This is not so much an actual change to the racial mix of the population as it is a change to the way people express who they are. But regardless of how the question is asked, the U.S. is more diverse than ever and that trend is likely to continue.
The distribution of the population across the 50 states also followed trends that have been well documented in recent years. The south had several states (Texas, Florida, Georgia) that were among the top five in absolute population gain, and the west had 5 states (Utah, Idaho, Nevada, Colorado, Washington) that were in the top 10 for the rate of population growth. The anomalies were North Dakota and Delaware which both had double digit growth rates in regions of slower growth. Only three states declined in population (West Virginia, Mississippi and Illinois).
Since only a few states consistently have a natural population decrease (only four in 2019: West Virginia, New Hampshire, Maine and Vermont), the primary differentiator of population change is the net difference in international immigration and domestic migration. Migration patterns can fluctuate from year to year and are not easy to accurately pin down, but the general patterns are fairly consistent. Florida, California, New York and Texas tend to be high on the list of international immigrant destinations. Midwestern states other than Illinois tend to be in the middle of the pack. Domestic migration tends to favor the south and the west, with Indiana being the only midwestern state to make the top 20 list in 2018-2019. California, New York and Illinois are the states with consistently large domestic out-migration. The midwestern states of Michigan, Ohio and Kansas also tend to suffer from out-migration more often than not.
States in the Midwest
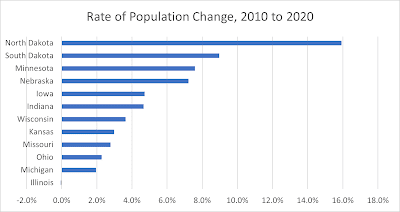
During the 2010 to 2020 period, the midwest region grew by 3.1 percent -- less than half the national rate. This is consistent with the trend of the last several decades. Consequently, the region’s share of the national population dropped from 24 percent in 1990 to just under 21 percent in 2020. All of the states did show positive growth, however, with the exception of Illinois whose population declined by just one tenth of one percent.
Minnesota, Indiana and Ohio were the top states in terms of population gain with increases of roughly 400,000, 300,000 and 260,000 respectively. In terms of the rate of population increase, North Dakota (15.9%), South Dakota (9%), Minnesota (7.6%) and Nebraska (7.4%) led the way. These same states were the only ones to grow at a rate faster than the country as a whole (7.3%).
I calculated two measures of this tendency for each state: (1) the percentage of counties that grew in population from 2010 to 2020, and (2) the number of counties that could account for all of a state’s population growth (i.e., the degree of population concentration). The states where rural decline was most widespread were Illinois, Kansas, Nebraska, Missouri and Iowa -- all of which had a decreasing population in over two-thirds of their counties. Only Wisconsin and Minnesota, states with significant recreational opportunities in rural areas, had growth in more than half of their counties.
In terms of states with a highly concentrated population growth, the most notable examples were Kansas (2 counties out of 105 accounted for all growth), Nebraska (3 counties out of 93), Missouri (5 counties out of 115), and Iowa (5 counties out of 99). In short, people in agricultural states are attracted to the few large cities that these states contain because they offer job opportunities, earning potential and social amenities that small towns and rural counties cannot match. At the other end of the spectrum, Wisconsin (26 counties out of 72) and Minnesota (21 counties out of 87) showed the least concentration of population growth.
Cities in the Midwest
Given the relatively lackluster growth performance at the state level, it would be logical to assume that midwestern cities are in the same boat. And yes, out of the 23 metropolitan areas with a population of over 300,000, there are five that lost population during the past decade (Flint, Peoria, Rockford, Chicago and Davenport). But the other 18 gained in population and 13 of those gained at a rate that exceeded the average growth rate for the region. Nine of the metro areas (Des Moines, Columbus, Lincoln, Indianapolis, Omaha, Minneapolis, Grand Rapids, Springfield, and Kansas City) grew at rates that exceeded the national growth rate. So there are a significant number of urban areas that are doing just fine.
It is also interesting to look at the primary city in each of the 23 metro areas. In more than half of the cases, the core city grew faster in the past decade than the metro area as a whole. Omaha, Columbus, Lincoln, Minneapolis, Kansas City and Ann Arbor not only grew faster than their associated metro area during the 2010 to 2020 time period, they also grew at a more rapid rate than the country as a whole.
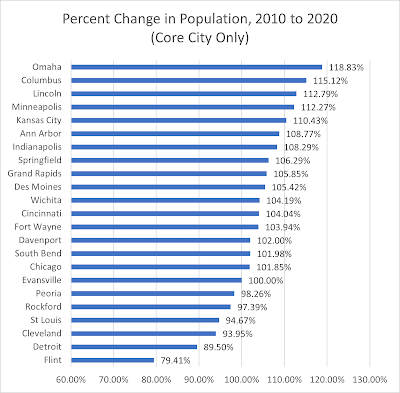
In addition, there is clear evidence that the primary cities did better in the most recent decade than from 2000 to 2010, and out-performed the overall metro areas in the same comparison. For example, only 5 of the 23 metro areas grew faster during the 2010 to 2020 time period than during the 2000 to 2010 time period. But 17 of the primary cities grew faster between 2010 and 2020 compared with 2000 to 2010. In addition, five of the primary cities that gained population in the most recent decade had lost population between 2000 and 2010. This trend needs further study with more detailed census results, but these numbers appear to be pointing toward a rebirth of the urban core during recent years.
Moving Forward
Civic leaders and Chamber of Commerce types often chase population growth as if it were an essential ingredient of a successful city. I would argue that a focus on population growth is not nearly as useful as a focus on economic growth. It is economic growth that provides households with a path to a better lifestyle, and perhaps more importantly, a path for those living in poverty to become economically successful. The two things are linked, but population growth does not necessarily lead to the scale of economic growth that can improve lifestyles across the community. The missing ingredient is productivity. Cities have to find ways to improve the productivity of the workforce in ways that match the needs of businesses that have the potential for growth.
Thus, the secret to economic growth is to simultaneously attract (or nurture) businesses with growth potential and workers with the skills that those businesses need. I will return to the topic of economic growth in future posts, but for now I will simply say that I think many midwestern cities are on the wrong track. They have workers whose skills are declining in demand and they have businesses with limited growth potential. Getting out of this rut will require understanding that the future will be different from the past.
Suffice it to say that I think the road to economic vibrancy will not be paved with economic incentives to out-of-town firms or with bigger convention centers or with new stadiums for professional sports teams. Cities would be better off focusing on an efficient hard infrastructure (transportation systems and utility services) that businesses and citizens need to be productive,
Thoughts? As always, share your thoughts and ideas by leaving a comment below or sending me an email at doug@midwesturbanism.com. Want to be notified whenever I add a new posting? Send me an email with your name and email address.
Notes:
Karen Guzzo and Krista Payne; “Average Age at First Birth, 1970 & 2017”; National Center for Family and Marriage Research, Bowling Green State University; 2018; https://docs.google.com/document/d/1Qz5Ma8qo7B-cIX8CMM1YIIr5CRKqvrKPv87VBEsioWw/edit.
Unless otherwise noted, all statistics are based on data from the U.S. Census Bureau.
No comments:
Post a Comment